

August 10, 2026
Barrick’s IV Crush Is the Real Headline
Featured: Barrick’s IV Crush Is the Real Headline
HI, I’m Alex Reid.
After trading the markets for years and licensing stunning algos for private clients back in the day…
I figured I should come clean about a shocking AI breakthrough.
At its core, this AI secret scans the market every morning for stocks that have been quietly building momentum over days or even weeks…
And are now nearing a potential point of acceleration.
Instead of chasing headlines, the software narrows the field to the single stock most likely to make a decisive move within the day.
It doesn’t stop there…
It goes a step further by outlining specific options criteria designed to align with that move, aiming to translate price action into outsized trade opportunities.
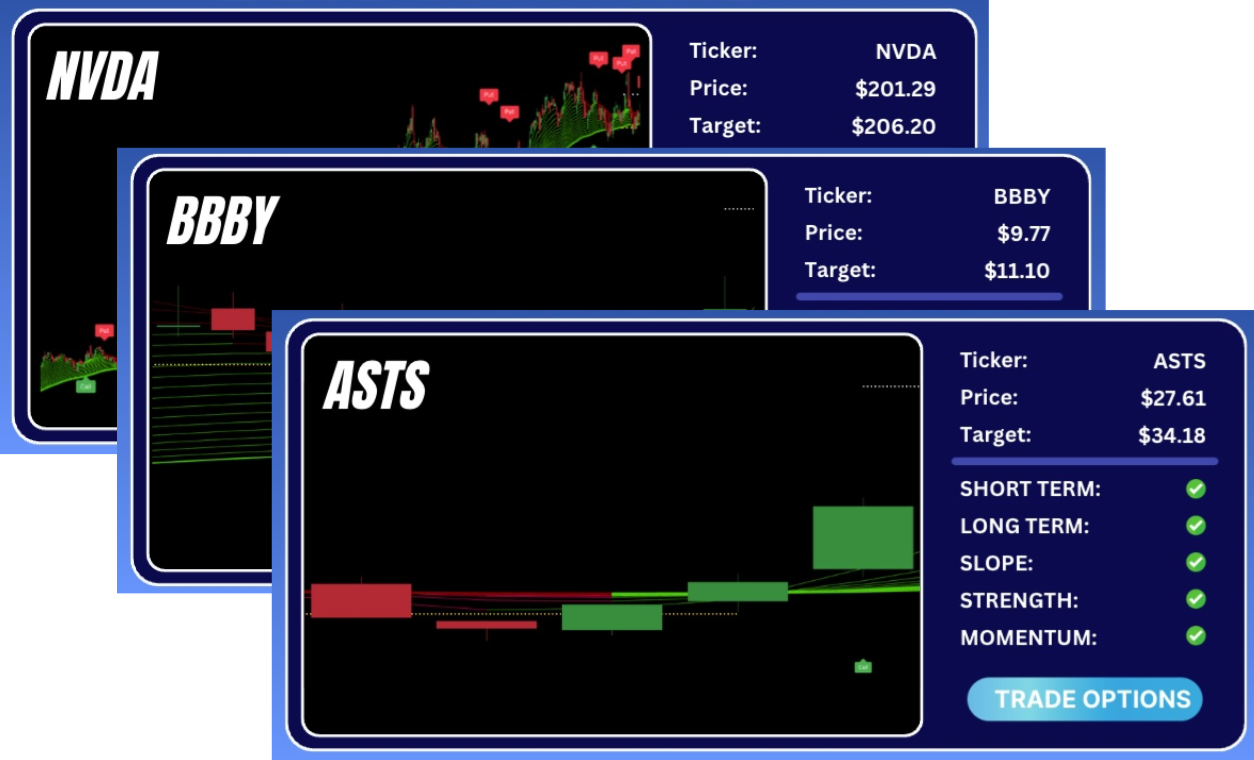
Basically, you’re being handed everything you need to take a trade even before you sit down for a sip of your morning coffee.
I can’t make guarantees when it comes to trading.
But if you’d like to see how the Wave Software identifies momentum before it becomes obvious…
And how you can begin using it for your trades as soon as tomorrow morning…
I’ve laid out all the details right here.
To Better Trading,
Alex Reid.
The Straddle Said 7.5%. Barrick Moved 2.5%.

The Signal
Barrick Mining (NYSE: GOLD) reported Q2 results before the open today. The stock fell roughly 2.5%. That move is not the interesting part.
The interesting part is what the options market said before a single number was released. The August 14 weekly $44 straddle was priced for a move of 7.5%. The call/put ratio heading into earnings stood at 2.6 to 1. That is not a hedging posture. Institutional participants were leaning into upside, with enough premium in the straddle to absorb a miss in either direction. They anticipated a structural catalyst. They were correct about the catalyst. They badly miscalibrated how the market would react to the cost data sitting beside it.
The realized move of roughly 2.5% is less than one-third of what the straddle implied. That gap, between what the options market priced and what the stock actually did, is where the next trade is forming. Post-earnings implied volatility is collapsing on both sides. The cost of options across the term structure is resetting lower. For traders who understand how to use that reset, the more important question is not what happened this morning. It is what the volatility surface is saying now that the earnings event has cleared.
Why It Matters
Context for the straddle pricing: over Barrick’s eight most recent quarterly earnings releases, the stock has averaged an absolute Day 0 move of 4.15%, with individual outcomes ranging from a 9.08% surge in August 2024 to a 7.16% decline in February 2026. The February drop is instructive. That quarter was also a beat on production. The stock still fell 7.16% on Day 0, then recovered 2.71% the following session. Options desks priced today’s 7.5% implied move against that historical range. The actual result came in well below the floor of prior reactions, which makes this one of the larger volatility overestimates on a Barrick earnings date in recent memory.
The call skew carries its own message. At 2.6 calls per put pre-earnings, the flow was speculative, not defensive. It reflected a specific bet: that the Newmont joint venture resolution, which had been broadly anticipated but whose financial terms were unknown, would drive a sharp upside reaction. The bet got the direction of the catalyst right and the direction of the stock wrong. That combination, correct thesis, wrong short-term reaction, is common after earnings when cost data dominates the headline over structural developments buried deeper in the release.
When a call-heavy positioning gets a down day, the result is a double compression. Pre-earnings call buyers absorb losses from both delta and vega simultaneously. The entire surface reprices lower as realized volatility comes in well below implied. That repricing is not just a reflection of what happened today. It creates the conditions for the next entry, at a lower premium cost, targeting the catalysts that the market has not yet priced into the options surface.
The Company Behind the Signal
Barrick’s Q2 miss was structural, not operational. Adjusted EPS of $0.82 missed the consensus estimate of $0.94. Revenue of $5.29 billion came in below the $5.67 billion consensus. Those numbers look like a straightforward earnings shortfall. The underlying data is more complicated.
Gold production came in at 796,000 ounces for the quarter, an 11% sequential increase that exceeded guidance of 730,000 to 770,000 ounces. Revenue grew 44% year-over-year. Adjusted EPS of $0.82 was still up 74% from Q2 2025. The mines did not underperform. The cost base absorbed the production gains before they reached the bottom line.
All-in sustaining costs reached $1,866 per ounce, up 11% year-over-year and sitting in the upper half of Barrick’s own full-year guidance range of $1,760 to $1,950. Gold cost of sales was $1,993 per ounce, up from $1,654 in Q2 2025. The company identified three drivers: lower ore grades at Carlin, Cortez, and North Mara; higher fuel costs; and higher royalties tied to the stronger realized gold price. Two of those three are partially outside management control. The grade issue at those Nevada assets is the one that demands the closest monitoring through the back half of the year.
The sequential cash flow deterioration is the sharpest number in the release. Attributable free cash flow dropped to $141 million from $1.213 billion in Q1 2026. Operating cash flow fell from $2.55 billion to $1.70 billion quarter-over-quarter. Revenue was virtually flat, at $5.29 billion versus $5.22 billion in Q1. The cost base, not volume, drove the compression. Whether Q3 becomes a recovery or a continuation depends almost entirely on whether grades recover at Carlin and North Mara.
The Newmont agreement is the structural development the market is underweighting. Barrick and Newmont resolved all outstanding Nevada Gold Mines disputes. Newmont will pay Barrick $1.95 billion in cash within 30 days. Both companies are contributing previously excluded properties: Barrick adds Fourmile, Newmont contributes Mike and Fiberline. The result is a nearly 100-million-ounce Nevada complex. Newmont also consented to Barrick’s planned IPO of its North American gold assets, removing what had been the most significant structural overhang on the stock for the better part of a year.
The IPO structure is worth understanding precisely. Barrick is not liquidating core assets. It is spinning out a minority stake in a newly formed vehicle holding the North American gold portfolio while retaining majority ownership. A nearly 100-million-ounce Nevada complex, organized under its own public vehicle, trades at a very different multiple than the same ounces buried inside a diversified global miner. The royalty and streaming market will price that asset differently. Barrick targets completing the IPO by year-end 2026, subject to market conditions and regulatory approvals.
America’s Oil Safety Net Is Running Low. What’s Your Reserve?
The U.S. Strategic Petroleum Reserve sits near its lowest level since 1983. The nation’s emergency stockpile can be drained, but gold cannot be printed or drained. That is why many retirees are learning how a Gold IRA generally works, and how they may move a portion of an IRA, 401(k), TSP, or 403(b) into physical metals. Start with the FREE guide from America’s Gold Company.
Request your FREE Precious Metals Retirement Guide from America’s Gold Company today.
Market Expectations
Two distinct expectations were priced into Barrick’s options surface going into today. The 7.5% straddle reflected genuine uncertainty: would the cost data overwhelm the Newmont catalyst, or would the structural announcement dominate? The 2.6:1 call/put ratio resolved that uncertainty with a directional lean: the market believed the Newmont news would win.
Both were wrong in the same direction. The stock moved down, not up, and moved far less than the straddle implied. The implied move was roughly three times the realized move. That ratio is not common. When it occurs around earnings, the post-event volatility surface tends to compress sharply across the term structure for the following two to four weeks, making options cheaper across all expirations relative to where they were before the event. That compression is the current opportunity. It is not permanent, but it is typically exploitable for 10 to 20 trading sessions before new catalysts rebuild the premium.
The gold price backdrop is a variable that no options model fully resolves. Bullion hit $5,595.46 per ounce on January 29, 2026, an all-time high, before retreating below $4,000 per ounce in late June on rate-hike expectations and dollar strength. Barrick’s consensus Q2 average realized price was estimated at $4,507 per ounce, up roughly 37% year-over-year, which is why EPS grew 74% despite the cost miss. If gold stabilizes in the $4,200 to $4,500 range through Q3, the cost-to-revenue spread may begin recovering without requiring a dramatic operational fix in Nevada. If bullion falls back through $4,000, the revenue buffer narrows fast.
Analyst targets entering earnings were wide. JPMorgan held Overweight at a $50 price target. Barclays held Equal Weight at $39. Citi cut to $41 with a Neutral, citing gold price uncertainty. The 24-analyst consensus 12-month target of $52.87 implies roughly 21% upside from Barrick’s $43.68 pre-earnings close. That spread between the Barclays floor and the JPMorgan target, $39 to $50, effectively defines the trading range the options market is now pricing for the next 60 to 90 days.
Strategic Considerations
The IV crush changes what makes sense structurally. Buying a 7.5% straddle into earnings required a significant move just to break even. Buying options in the same name after the IV collapse, with the surface repriced for a much smaller forward move, is a materially different cost environment. Three frameworks fit the current setup, each tied to a specific read on what happens next.
Bull case: debit call spread. If the Newmont agreement and the North American IPO represent a structural re-rating that the Q2 cost data delayed rather than derailed, the post-crush surface offers a better entry for upside exposure than anything available before this morning. A September or October debit call spread targeting the $47 to $52 range allows participation in a recovery toward consensus analyst targets while capping the premium at risk. The thesis is not Q2 earnings. It is whether Barrick shows cost stabilization in Q3 guidance and whether the IPO filing process generates public signals before year-end. The cost of this spread is materially lower now than it was at any point in the prior two weeks.
Bear case: put spread. Free cash flow of $141 million in a quarter where Barrick returned $1.5 billion to shareholders is a ratio that cannot hold indefinitely without balance sheet support. For traders who read the AISC trajectory as a leading indicator of further compression, a defined-risk September put spread targeting the $38 to $40 range reflects the scenario where grades at Carlin and North Mara fail to recover in Q3 and AISC approaches or breaches the top of full-year guidance. The Barclays $39 target provides a natural reference for the lower strike. The primary trade-off is time decay: if Barrick holds the $42 to $44 range through mid-September, the spread loses most of its value without a directional move to justify the position.
Neutral case: iron condor. If today’s selloff fully exhausts the market’s negative reaction to Q2 and Barrick consolidates while the IPO process unfolds quietly through the fall, an October iron condor with wings set near the $38 and $50 levels captures the premium the market is pricing for longer-dated uncertainty. Post-earnings IV is lower than it was pre-event, which reduces the credit collected versus what was available before today. But for traders who expect a range-bound stock for 60 days with no step-change catalyst, the structure offers a way to monetize the residual uncertainty premium that longer-dated expirations still carry. The primary risk is a sharp gold price move or an accelerated IPO announcement that breaks the stock out of the range in either direction.
One principle applies across all three frameworks: defined risk is not optional here. Barrick carries unresolved variables across multiple timeframes, grade recovery, IPO execution, gold price direction, and copper production ramp, that make uncapped directional exposure in either direction an inappropriate sizing decision. The options surface, even at post-crush levels, is pricing genuine uncertainty. Structures that fix the maximum loss at entry are the right tools for this environment.
Risk Analysis
The cost structure is the most immediate risk, and it does not resolve quickly. AISC of $1,866 per ounce against a full-year guidance ceiling of $1,950 leaves $84 of headroom. That sounds manageable until you recognize that grade is a geological variable. Management cannot mandate better ore. If Q3 grades at Carlin, Cortez, and North Mara remain suppressed, AISC will hit the top of guidance and the conversation shifts from cost management to guidance revision. That is a different market reaction than today’s.
Gold price exposure is nonlinear. Bullion below $4,000 compresses the revenue line faster than any cost improvement can offset. Bullion above $4,800 widens the gross margin but simultaneously increases royalty obligations, one of the three stated drivers of Q2 cost pressure. The net margin impact of a gold price move is not a straight line, and traders who model it that way will misprice both directional spreads and premium-selling structures on this name.
The IPO execution risk is real and underappreciated in the current options surface because the market has not yet been asked to price it explicitly. Completing a minority-stake offering for a newly formed North American gold vehicle by year-end 2026 requires regulatory approvals, market conditions, and investor appetite for new mining issuances to align. If any element slips, the timeline moves to 2027 and the structural catalyst that drove the pre-earnings call skew disappears from the near-term horizon. That scenario does not destroy the thesis. It delays it, which is a meaningful difference for traders holding October or shorter-dated structures.
What to Watch
The options market spoke once this morning. The next time it speaks will be in response to one of the following developments. These are the signals worth tracking before the next position decision.
- AISC trend in Q3 guidance updates. Grade recovery at Carlin and North Mara is the single most important operational variable between now and the next earnings release. If those assets show improvement in any Q3 operational update, the bear case weakens materially and call spreads gain delta.
- Confirmation of Newmont’s $1.95 billion payment. The agreement specifies payment within 30 days. When that cash clears, it lands on a balance sheet already carrying roughly $1.2 billion in net cash. A combined position above $3 billion changes the capital allocation conversation and could accelerate buyback activity or IPO preparation timelines.
- SEC registration activity for the North American IPO. Any S-1 filing or confirmed roadshow activity would be a step-change catalyst that resets the options surface sharply higher in implied volatility. Monitor registration statement filings through Q4. The first public signal of an active filing is the moment the options market will begin pricing the IPO directly.
- Gold price at the $4,000 threshold. A sustained break below $4,000 per ounce narrows the revenue buffer faster than any operational improvement can compensate. Gold futures positioning and Federal Reserve rate language are the proximate weekly drivers to track.
- 30-day implied volatility compression pace. Watch how quickly IV settles over the next five trading sessions. A rapid compression toward the lower end of the 52-week IV range creates the most favorable entry window for defined-risk long structures targeting the IPO catalyst. A spike back toward pre-earnings IV levels signals a new risk forming that is not yet visible in the fundamentals.
Action Checklist
- The August 14 straddle implied a 7.5% move. The realized Day 0 move is approximately 2.5%. Post-earnings IV crush is confirmed and in effect across the term structure.
- The pre-earnings 2.6:1 call/put ratio reflected speculative upside positioning. Monitor whether that institutional flow reverses into puts or holds through the end of this week as a signal of repositioning intent.
- For traders with a bull thesis on the IPO catalyst, consider a September or October debit call spread in the $47 to $52 strike range, entered after IV has fully settled, likely 3 to 5 sessions post-earnings.
- For traders focused on continued cost pressure, a September put spread targeting the $38 to $40 range reflects the bear case with the Barclays $39 target as the structural reference for the lower strike.
- For traders expecting a range-bound consolidation, review October iron condor pricing between the $38 and $50 strikes once IV stabilizes. Confirm the credit received justifies the defined risk on both wings before entering.
- Mark the 30-day window for the Newmont $1.95 billion cash payment. Confirmation of receipt is the nearest-term balance sheet catalyst and worth monitoring for any accompanying capital allocation statement from management.
- Track gold price weekly against the $4,000 support level. A sustained break below that threshold changes the Q3 revenue model and weakens the bull case across all long structures.
- Monitor SEC EDGAR for any Barrick registration statement or S-1 activity related to the North American IPO vehicle. That filing is the medium-term event the current options surface has not yet priced.