
June 25, 2026
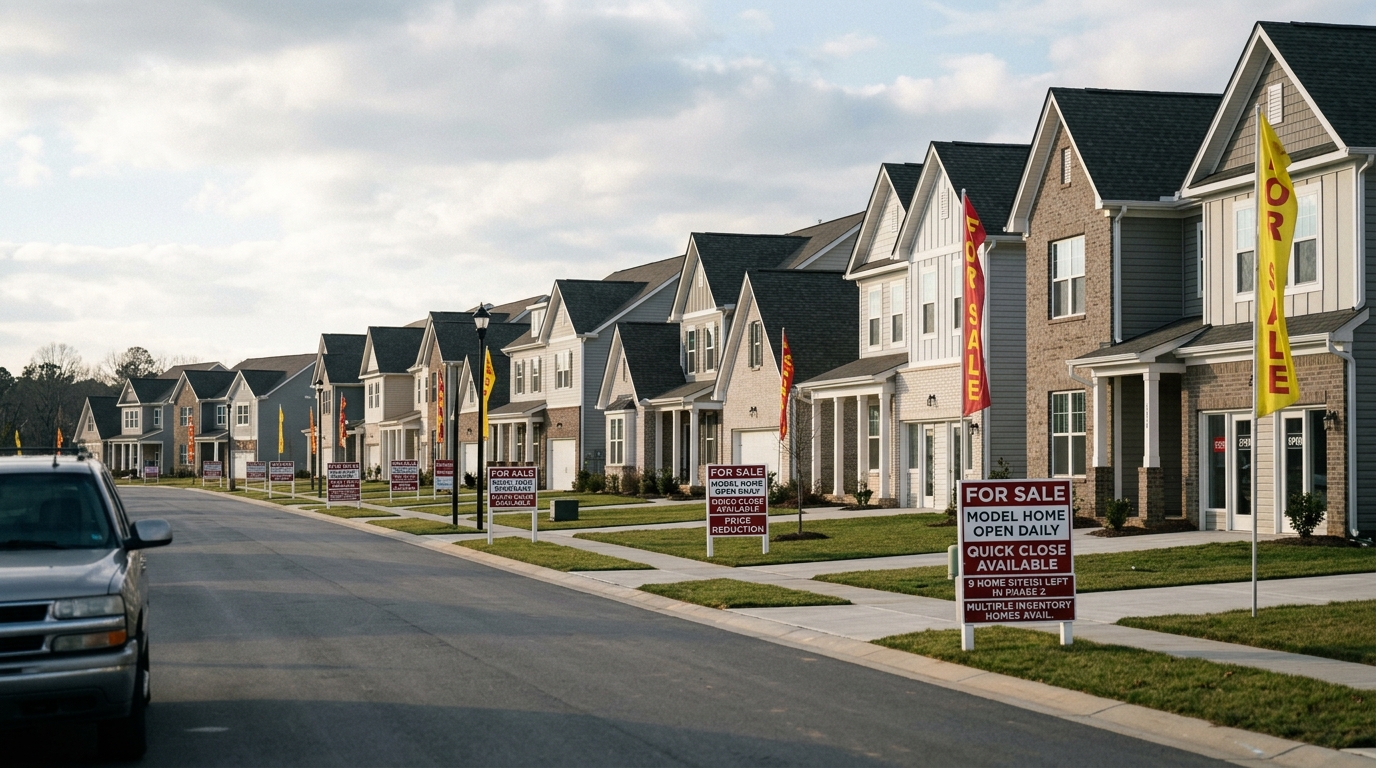
New Homes Aren’t Selling
The inventory number nobody is talking about just hit 10.3 months.
New home sales just hit a four-month low. The headline number is bad. The inventory number underneath it is worse.
The Census Bureau reported that sales of new single-family homes in May 2026 came in at a seasonally adjusted annual rate of 580,000 units, down 7.3% from April’s rate of 626,000 and 6.8% below the May 2025 pace of 622,000. Wall Street was looking for something closer to 632,000. The miss was not a rounding error.
But here’s what most of the coverage skipped.
The seasonally adjusted estimate of new homes for sale at the end of May rose to 496,000, up 2.3% from April’s 485,000. At the current sales pace, that represents 10.3 months of supply. In April it was 9.3 months. That single-month jump is the kind of data point that shows up quietly in a government release and then matters a lot three to six months later when builders start pulling back on starts. Housing starts in May were already down 15.4% month-over-month to a six-year low, per the same government data. The feedback loop is starting.
For context: a healthy new home market typically runs at 5-6 months of supply. Readings above 9 months have historically been associated with meaningful builder margin compression, incentive escalation, and eventually permit pullbacks that ripple into construction employment.
Mag 7’s relentless assault on Nvidia’s future
Nvidia’s biggest customers are now buying and selling chips to each other. That means, the virtual monopoly that fueled NVDA’s $4 trillion market cap is OVER. If you currently own NVDA, here’s a better alternative. Their competition is scarce, which puts them in a hugely advantageous spot. This supplier’s stock has outperformed Nvidia’s by 50X since July.
Click to get the full details on this urgent “Nvidia alternative” right here.
The West Is the Story Nobody Is Watching
Regionally, the breakdown was striking. Sales in the West dropped 26.9% month-over-month in May to 117,000, a seven-month low. The South, which accounts for roughly 60% of all U.S. new home sales, fell 4.1% to 350,000, the lowest level since January. The Midwest recovered 16.2%. The Northeast was up about 3%.
The West is where affordability math breaks down first and most visibly. The average selling price for new homes reached $540,600 in May, up 7.8% from April and 5% above year-ago levels. The median price came in at $424,900, essentially flat year-over-year. Combine that with mortgage rates sitting at 6.44% in May per Freddie Mac (currently 6.49% as of late June), and first-time buyers in California, Arizona, and Colorado are essentially priced out at the entry level. Only about 15% of new homes sold in May came in under $300,000, according to Census data. That’s the affordability wall in plain numbers.
That’s not strength. That’s a market telling you something.
What the Builders Are Actually Doing
This is where it gets interesting. Builders have been using margin compression as a demand lever, buying down mortgage rates at their own expense, for the better part of two years. That worked when rates were expected to fall quickly. With rates now holding in a 6.4%-6.5% band and showing no urgency to move lower, the math gets harder every quarter.
Homebuilder confidence fell again in June to a seven-month low, according to industry tracking. That’s not sentiment noise. That’s builders updating their forward-looking assumptions in real time.
Slight tangent, but it matters: the year-to-date picture in the West is actually down 11.4% in new home sales volume. One bad month is noise. A persistent five-month trend in the country’s most expensive housing markets is something else. Builders are already responding with tighter specs and more aggressive buydown programs on surviving projects.
Existing home sales told a different story for May, up 3.2% to a 4.17 million annual rate, with a median price of $429,300 and 4.5 months of inventory. That divergence between new and existing is worth noting. Existing home sellers, locked into low mortgage rates from 2020-2021, are still reluctant to list in large numbers. But when they do list, those homes are moving faster than new construction right now. That’s a reversal of the post-pandemic dynamic that drove builder revenues to record levels.
Run This 7-Point Check Before Your Next Trade
Ever been right about a stock’s direction and still lost money on the trade?
It happens to almost every beginner. And it’s almost never bad luck – it’s a checkpoint you skipped before you placed the trade.
I put the 7 that matter most on one page.
It’s called the Smart Trade Options Checklist. Normally $29.97. Free today.
Run it before any options trade. About 30 seconds. You’ll catch the bad ones before they cost you.
The Stocks That Feel This First
The public homebuilders are the most obvious pressure point. D.R. Horton, Lennar, PulteGroup, and NVR all have significant exposure to the exact price points and geographies where stress is most visible right now. Builder margins held up through 2024 and into early 2025 because land costs were locked in at favorable levels and incentive spending was manageable. Both of those tailwinds are fading.
Mortgage REITs and title insurance companies feel this too. Slow sales mean slower origination volume, which compresses fee income at companies like Pennymac, Mr. Cooper, and Fidelity National Financial.
And then there’s the broader labor angle. Housing construction employment is a significant piece of the U.S. workforce. If starts follow sales lower, which historical patterns strongly suggest they will at 9-10 months of supply, the residential construction workforce starts to shrink. That tends to arrive quietly in the data before it shows up in the headline employment numbers.
10.3 months of supply. Remember that number. It tends to matter more than people think when they first see it.