July 14, 2026
One Sector. One Catalyst. One 21-Mile Waterway.
A note from Reagan Gold
In 1913, the income tax was sold as something that would barely touch regular Americans.
It was aimed at the rich.
One generation later, the tax system reached nearly everyone.
Now, politicians are once again talking about taxing wealth, unrealized gains, retirement accounts, and other accumulated assets.
The message sounds familiar:
“It’s only for billionaires.”
But if history is any guide, policies that begin with the wealthy can eventually move down to everyday Americans who worked hard, saved money, and built retirement accounts.
That is why many Americans are asking a simple question:
How do I protect what I have already earned?
Reagan Gold created a free guide that explains, in plain English, why physical gold is getting renewed attention from retirement savers.
You’ll discover:
How retirement accounts could become a target
Why gold has been used as a store of value for generations
What a Gold IRA is and how it works
Why some wealthy Americans move before the crowd
What steps you can consider now, before policy changes
You worked too hard to build your retirement savings.
Now is the time to understand your options.
GET YOUR FREE GOLD GUIDE TODAY
GET YOUR FREE GOLD GUIDE TODAY
FEATURED
One Sector. One Catalyst. One 21-Mile Waterway.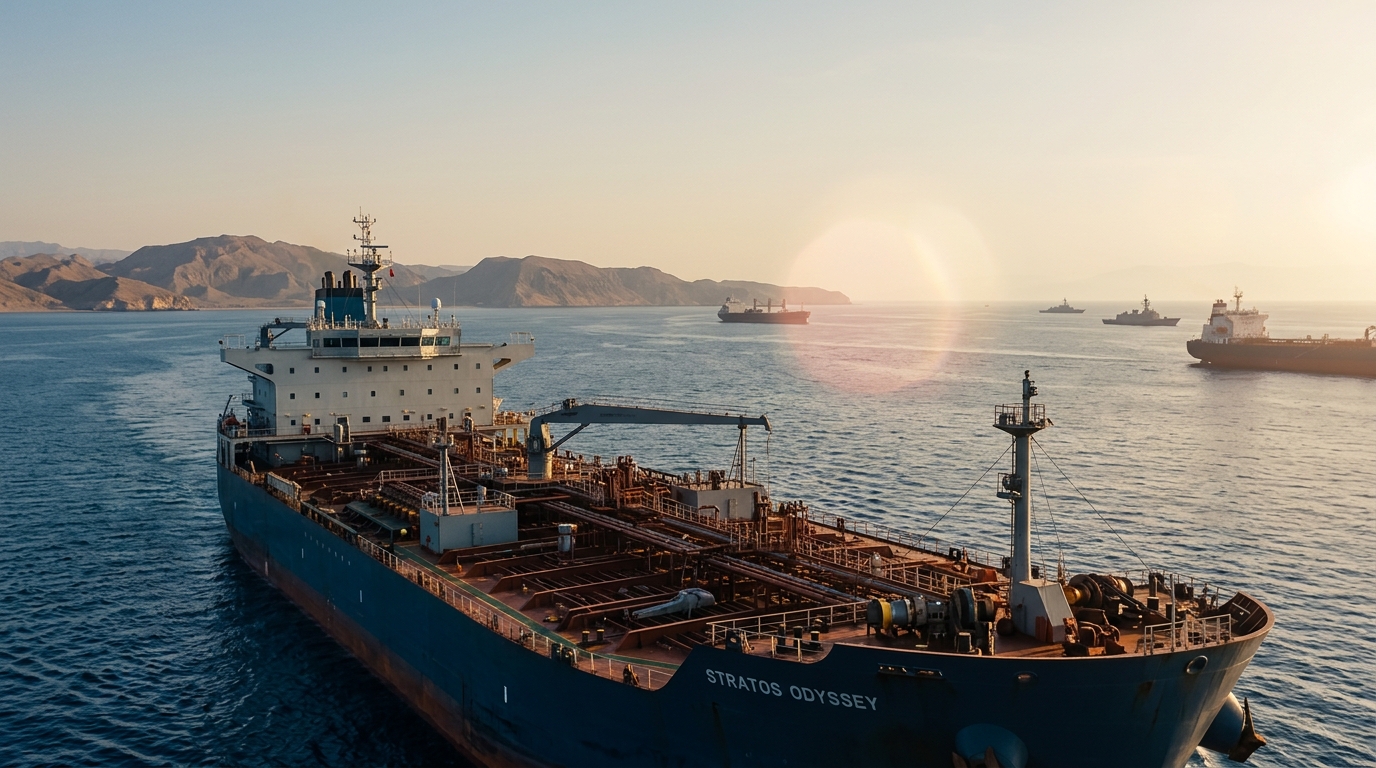
Today at a Glance
- Brent crude is trading near $86.35–$87 on July 14 — up roughly 10% in two sessions — after Trump reinstated the U.S. naval blockade of Iranian ports, effective 4 p.m. ET today
- Strait of Hormuz transit traffic has dropped to 34 crossings per day vs. a pre-crisis baseline of 88, according to Kpler shipping data — an 85% reduction from normal flow
- June CPI came in sharply below expectations: headline fell 0.4% (vs. -0.1% to -0.2% consensus), annual rate dropped to 3.5% from 4.2% in May, core was flat vs. +0.2% expected
- The soft CPI data likely takes a July Fed hike off the table — but oil is already pushing higher again in July, making the August CPI number the real watch item
- Energy is the only S&P 500 sector with clear positive momentum this week; XOM and CVX are both trading well below their Q1 crisis highs despite crude re-accelerating
- XLE holds XOM at ~19.8% and CVX at ~14.7% as of early July — combined, about 34.5% of the fund — making it the cleanest single-ticker expression of the energy trade
- Key risk: a diplomatic resolution collapsed this trade in June within days — the same pattern can repeat, and quickly
Market Snapshot
Monday was one of those sessions where the market tells you exactly what it’s thinking. Tech cracked. Chips sold off. AppLovin fell roughly 12.7%. And while most of the S&P bled red, energy quietly posted gains of more than 3% on the day.
Then Tuesday arrived with two separate market-moving events landing within hours of each other. The June CPI report hit at 8:30 a.m. — headline fell 0.4%, the biggest monthly drop since April 2020, annual rate down to 3.5% from 4.2% in May, core flat. Every number came in softer than the consensus. On the surface that’s a relief trade for rate-sensitive assets.
At the same time, Brent crude was trading near $87. The U.S. military formally reinstated the naval blockade of Iranian ports at 4 p.m. ET today. Iranian forces struck two UAE oil tankers in the Strait this morning. The CPI data is backward-looking — it measures June, when oil was falling. The blockade is forward-looking. That gap between what inflation was and what it’s about to become is the defining tension in this market right now.
Why This Is Back in Focus — Again
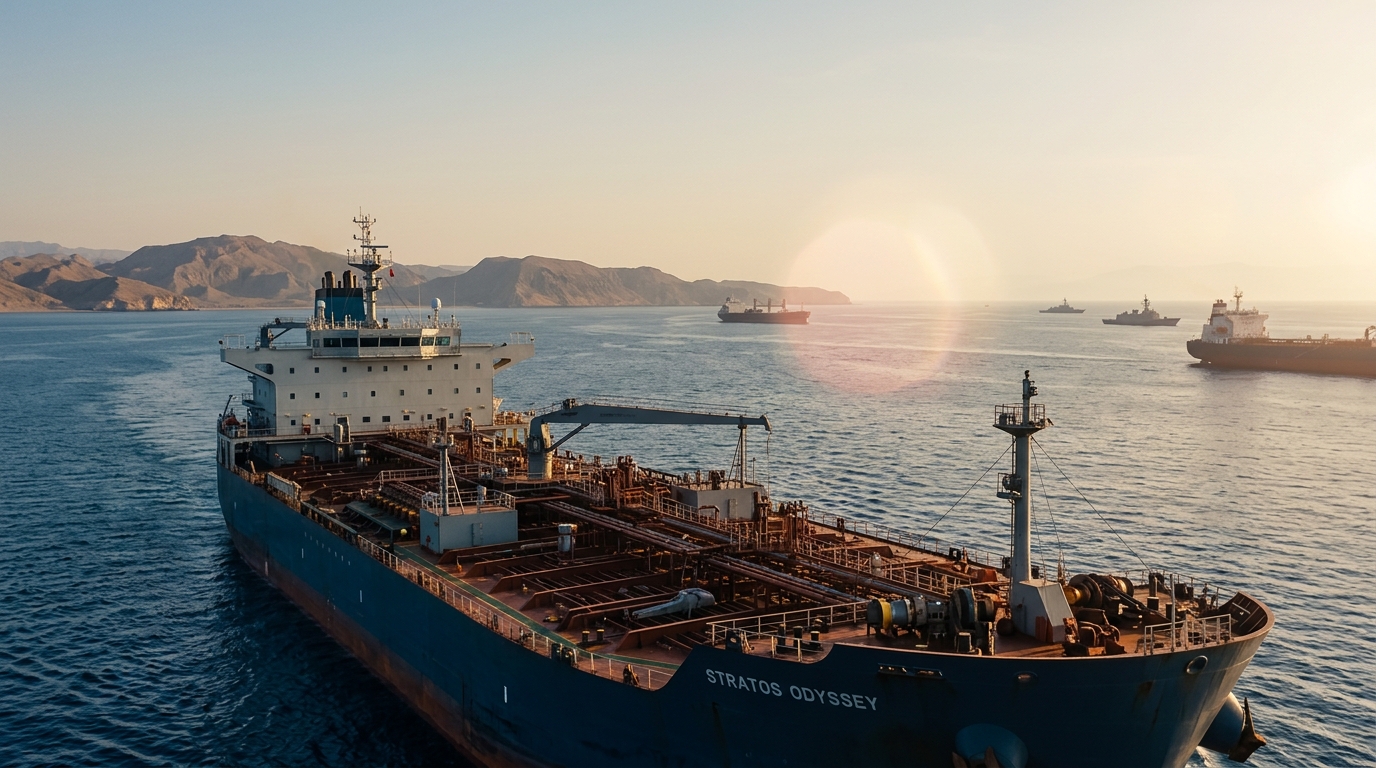
The 2026 Strait of Hormuz crisis has been the single biggest macro driver for energy markets since late February, when U.S. and Israeli strikes on Iran triggered the IRGC’s initial closure of the waterway. A ceasefire memorandum signed in Paris in mid-June briefly reopened the strait and sent crude tumbling. That lasted about three weeks.
Over the weekend, Iran attacked a commercial vessel in the strait. U.S. strikes followed. Trump declared the ceasefire over during a NATO summit last week and reinstated the blockade — this time framing it as the “Iranian Blockade,” targeting only Iranian ships and customers, while claiming the strait remains open to all others. Iran’s foreign minister responded by saying he agreed that transit should be compensated, but that 20% was too much. They would be “fair,” he wrote.
Here is the physical reality underneath the political theater: Kpler data shows Strait crossings fell to 22 ships last week — an almost 85% decrease from pre-crisis levels. As of today, transit is effectively closed to commercial shipping according to straits.live, which tracks AIS data in real time. Brent hit $86.35 on Trading Economics data as of today, with early futures around $86.99 per Fortune. The energy index component of CPI fell 5.7% in June. That tailwind is already gone.
The man CNBC calls “The Prophet” just revealed his biggest AI trade
And it isn’t Nvidia, Microsoft, or any chip stock you’ve seen on CNBC.
It’s a little-known company that controls the rare assets the entire AI boom can’t exist without.
One billionaire already put over half his $9 billion fund into it.
Right now it’s trading at a rare discount – weeks before the next dividend hits.
Wall Street Legend Whitney Tilson reveals the name and ticker, completely free.
The Stocks Worth Watching
ExxonMobil hit an all-time high of $176.41 during the height of the Q1 crisis. It’s now trading around $140–$144 — down more than 20% from that peak, with crude pushing back toward its highest levels since the ceasefire collapsed. Exxon’s Permian breakeven sits around $35 a barrel. Every dollar of oil price gains above that flows almost directly to earnings. The company guided $20 billion in share buybacks for 2026. XOM has a year-to-date return of roughly 17–26% depending on the data source and exact date measured — it’s been a volatile year.
Chevron is in a similar structural position. CVX closed Monday at $182.20, up 3.29% on the session, according to Yahoo Finance. The stock carries a dividend yield above 3.7% and has a forward P/E around 12.6x — modestly cheaper than Exxon’s 13.3x. Wall Street’s 12-month average price target on CVX implies roughly 9–10% additional upside from current levels, per Stocktwits analyst data. Both companies report Q2 2026 earnings later this month. That’s when the geopolitical story either gets a fundamental foundation — or doesn’t.
Worth mentioning: Occidental Petroleum has shown more price sensitivity to Hormuz-driven oil spikes than the integrated majors, given its higher oil-price beta. It’s been running ahead of XOM and CVX on individual crude spike days. If you want more leverage to the move, OXY is worth watching — though the analyst consensus still skews to Hold, and the Q2 earnings setup matters there too.
The ETF Framework
For traders who want sector exposure without single-stock concentration, XLE is the default. As of early July, XOM represents about 19.8% of the fund, CVX about 14.7% — combined, just under 35% of total assets. ConocoPhillips, Marathon Petroleum, Phillips 66, Valero, SLB, EOG, Williams, and Kinder Morgan round out the top 10, accounting for more than 72% of assets together.
OIH — the VanEck Oil Services ETF — is the higher-beta version. It captures services capex exposure and typically amplifies crude moves in both directions. Think of it as a tactical overlay rather than a core position. When Hormuz risk exits fast, OIH tends to give back more than XLE and do it faster.
The Inflation Wrinkle
This is the part worth slowing down on. The June CPI number released this morning was genuinely soft. The energy index fell 5.7% in June — its biggest monthly drop since April 2020 — and gasoline tumbled 9.7% month-over-month. That’s what drove the big downside miss. Core came in flat when the consensus was looking for +0.2%. The 12-month core rate dropped to 2.6% from 2.9% in May.
A former Goldman Sachs analyst quoted by CBS News this morning put it directly: oil and gasoline prices — the main reason inflation eased in June — have already started moving higher on renewed U.S.-Iran tensions, but the CPI won’t reflect this for another month. That’s the issue. The data looks backward. Oil is moving forward. July’s CPI — which won’t be published until August 12 — is where this gets complicated for the Fed.
The soft June reading likely ends talk of a July rate hike. Coindesk noted that July hike probabilities had climbed as high as 42% from just 8% a month ago before this morning’s number reset expectations. Fed Chair Kevin Warsh testifies to Congress today. His tone on the energy-driven inflation risk heading into August is worth tracking closely.
Three Scenarios
Bull: The blockade holds through Q3. Strait traffic stays near current lows. Brent pushes back toward the April peak near $121 (Brent hit a 52-week high of $120.88 on April 30, per Forbes). XOM and CVX retake their Q1 highs. OIH surges on services capex spending. The energy sector extends its year-to-date leadership by a wide margin.
Base: Tensions stay elevated but a working arrangement emerges in 3–4 weeks — similar to what happened after the first blockade. Oil stabilizes in the $80–$90 range. Energy stocks hold their recent gains without sharply re-accelerating. XLE trades sideways to slightly higher through Q2 earnings season.
Bear: A diplomatic agreement moves quickly. The strait reopens. Crude falls back toward the low $70s — or lower. Energy stocks give back a meaningful portion of the past two days’ gains. This is exactly what happened in June when the ceasefire sent both crude and XLE sharply lower within days. It can happen again. The market moves 3–5% on single statements from this situation.
Trader’s Checklist
- Strait transit data: Kpler and straits.live are the real-time gauges — watch for any step-change in daily crossings above or below current levels of roughly 22–34 per day
- CENTCOM and Truth Social: The blockade formally begins at 4 p.m. ET today; any CENTCOM clarification on fees, enforcement, or vessel interdiction will move prices fast
- Brent crude vs. $90: Whether crude holds, reclaims, or fails to clear $90 will do more to define the energy trade this week than any single data point
- XOM and CVX Q2 earnings: Both report later this month — cash flow guidance at current oil prices and hedge unwind disclosures will answer whether the energy trade has a fundamental floor beyond the geopolitical bid
- Fed Chair Warsh testimony today: His framing of the energy-driven inflation risk heading into August is the key macro signal; any hawkish pivot on the back of Hormuz escalation would reshape the rate path and hit growth names again
- China’s response: Beijing called for “normal and safe passage” to be restored Tuesday morning; if China takes concrete steps to support Iran or route around the blockade, that reshapes the supply picture materially
Bottom Line
The market had priced in a ceasefire. That ceasefire is gone. And the Strait — through which roughly 25% of global seaborne oil trade passed before the crisis — is now back to effectively closed, with 503 vessels anchored or stopped in the region according to straits.live.
The June CPI data this morning offered a temporary exhale. But the exhale is already colliding with a forward oil shock that doesn’t show up in the data for another month. Energy is positioned to stay in the leadership seat as long as Hormuz stays closed. The question isn’t whether the trade makes sense — it’s how long the catalyst lasts.
That answer depends on what happens in a 21-mile-wide waterway over the next few days. Traders can’t control that. They can control their position size, their entry levels, and whether they’ve defined the conditions that would make them wrong.
For informational and educational purposes only. Not investment advice. Trading involves risk of loss.