

July 15, 2026
Gold at a Crossroads
The metal hit a historic peak. Now the debate is whether the bull market is pausing or ending.
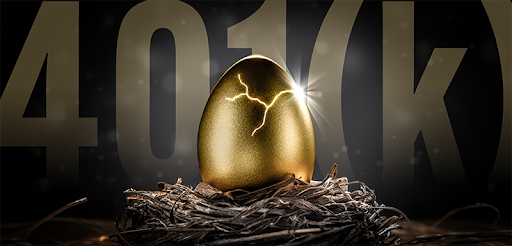
How Giants And Your 401(k) Can Fall Overnight
Spirit Airlines vanished over a weekend, what makes your 401(k) untouchable?
There is a dangerous assumption that became standard practice in many 401(k) portfolios. That major companies are safer investments because they are too big to fail.
Spirit Airlines flew for more than 30 years. Then, on May 2, 2026, it announced an orderly wind-down effective immediately and said all flights were cancelled as operations ceased.
And the stock-market lesson is even darker.
When Spirit emerged from restructuring in March 2025, the company said its old common stock was cancelled. One day, shareholders owned a recognizable airline. The next, that ownership was gone.
That is the danger inside many retirement accounts.
Too much faith in size.
Too much trust in familiarity.
Too much value in paper assets tied to companies that can fail faster than anyone expects.
When giants start falling, protection matters more than optimism.
Physical gold and silver remains one of the most trusted means of protecting your wealth.
Download a FREE copy of our 2026 Preservation Guide and we’ll show you the tax-free, penalty-free process thousands have used to protect their retirement wealth with gold.
Request Your FREE WEALTH PRESERVATION GUIDE Today!
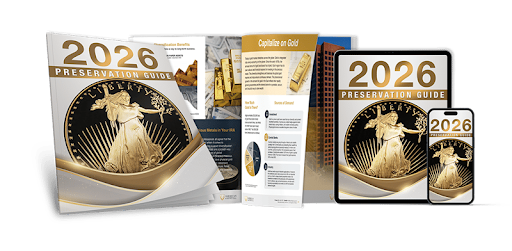
CLICK HERE TO GET THE FREE GUIDE
Gold at a Crossroads

On January 28, 2026, gold crossed $5,589 per ounce intraday. It was one of the most dramatic moves in the metal’s modern history, and it happened fast. Geopolitical shock, a weakening dollar, a Fed perceived to be losing its independence, central banks hoarding bullion at record pace. The setup looked almost too clean for gold bulls.
Then the bottom fell out. The U.S.-Iran conflict escalated, oil surged, inflation fears reignited, and suddenly the Fed was talking about rate hikes again instead of cuts. By late June, gold had dipped below $4,000. As of this week, it is trading around $4,030 to $4,060. That is still 21% higher than a year ago. But it is also roughly 28% off the January peak in five months.
That range, $5,589 to $4,000, is exactly where the investment committee debate is happening right now. Structural bulls versus tactical bears. Long duration versus near-term Fed risk. The question is not whether gold had a good year. It is whether the bull market that began in 2022 is intact, pausing, or quietly reversing.
Elon Musk’s Insane Projection: 7,692,207%
Where should you invest $100 right now?
Elon Musk just invented and patented this new AI technology…
And he’s predicting it will launch a NEW industry that will grow more than 7 million percent in the coming years.
Even if he’s only 10% right, that would still be enough to grow $100 into more than $700,000.
Click here to see the details on what Elon Musk called “an infinite money glitch.”
Why Institutions Are Paying Attention
Gold is no longer a fringe allocation in institutional portfolios. It has become a mainstream conversation. The reasons are straightforward: traditional 60/40 portfolios have struggled in periods of positive stock/bond correlation, and U.S. equity valuations leave little room for error. Gold fills a gap that bonds no longer reliably fill.
The World Gold Council’s mid-year 2026 outlook, titled “Point Break,” captures the tension well. In one of the most dramatic starts to any year, gold soared to record highs in January, crossing above $5,500 per ounce intraday before dipping below $4,000 in late June. Down roughly 7% year-to-date, gold nonetheless ranks among the top performers over the past year. That combination, down year-to-date but still outperforming most asset classes on a 12-month basis, is what makes the positioning debate so interesting.
Here is what makes this moment different from prior corrections: buying by hedge funds, banks, and large institutional investors is providing a safety net for the gold price. COMEX net longs jumped 16% month over month in June to 538 metric tons, their highest month-end position since January. That is not retail panic buying. That is institutional accumulation on the dip.
The Bull Case
The structural case for gold starts with debt, and the numbers are genuinely alarming. Global debt hit a record $353 trillion at the end of Q1 2026, more than 3x world GDP. The government share of that debt also hit a record 31%. Elevated sovereign debt loads raise concerns for investors about diminishing purchasing power, constrained fiscal space, and structurally higher borrowing costs.
The central bank buying story has also not gone away, despite a brief pause. Central banks have been buying gold at record levels for three consecutive years as they diversify reserves and, in many cases, actively reduce reliance on the U.S. dollar. This structural shift in official-sector behavior appears set to continue. The People’s Bank of China alone added nearly 15 tonnes in June 2026, bringing its total reserves to over 2,346 tonnes. That is not a tactical trade. That is a decade-long portfolio shift.
Then there is the ETF angle, which is more interesting than it appears. Western investment demand has finally turned higher. Gold ETF holdings remain well below prior peaks, suggesting substantial room for additional inflows. That matters because the 2011 and 2020 gold peaks were accompanied by ETF holdings near all-time highs. The current cycle is not there yet, which implies the rally has more structural fuel left than price alone would suggest.
VanEck, one of the more experienced gold asset managers, had forecast gold reaching $5,000 earlier this year, and gold surged above $5,000 per ounce in 2026, having reached an intraday high of $5,595 on January 29, 2026, before pulling back. State Street Global Advisors is projecting a baseline of $4,750 to $5,500 per ounce within six to nine months, with a 70% probability. State Street’s own view: the historic bullion bull market cycle that started taking shape in 2023 to 2024 is likely to continue through 2026. Gold clearing $6,000 per ounce is more probable than a dip below $4,000 per ounce over the next 6 to 12 months.
The Bear Case
The tactical case against gold right now comes down to one word: the Fed. Markets see roughly a 49% chance of a September rate hike as higher oil prices, driven by ongoing U.S. strikes on Iran, the reimposition of a naval blockade on Iranian ports, and the closure of the Strait of Hormuz, continue to pose upside risks to inflation. Fed Chair Kevin Warsh has reaffirmed that the central bank has “no tolerance” for persistently elevated inflation.
This is not a subtle headwind. Gold has no yield. When real rates rise, the opportunity cost of holding it goes up. Goldman Sachs cut its year-end 2026 gold target from $5,400 to $4,900 in June, citing the hawkish pivot. The bank noted that if the Fed actually delivers a rate hike, gold could fall toward $4,400 by year-end. That is not a catastrophic call, but it is a meaningful reset from where the bulls were positioned six months ago.
The North American gold ETF market was the only region to suffer a loss overall in H1 2026, posting its weakest first half since 2013. Analysts attributed the $7.7 billion in gold ETF outflows to growing expectations that the Federal Reserve will require higher interest rates to combat energy-related inflation fueled by the U.S.-Iran war. Such a monetary environment raises the opportunity cost for holding non-yielding assets such as gold.
There is also a less-discussed risk: the correction has already happened, and recoveries from corrections of this magnitude are rarely linear. At current levels, gold’s price is broadly in line with a global backdrop of moderate growth, cooling but still elevated inflation, and expectations of further but limited central bank tightening. Under these conditions, gold will likely stay relatively rangebound. But the stage is set for a possible breakout. Rangebound is not a bear call, but it is not a bull call either. For a fund with a finite horizon, that is a problem.
The Evidence
The most telling data point in this debate may be the one people are not talking about enough: the constraint on the Fed’s ability to hike aggressively. As of early July, U.S. gross national debt stands at approximately $39.4 trillion. At an average interest rate of around 3.41% on outstanding marketable debt, annual interest expense already exceeds $1 trillion per year, roughly $2.9 billion every single day. A central bank that cannot raise rates aggressively without straining Treasury’s own borrowing costs is not operating freely. That structural ceiling does not stop rate hikes, but it does limit how far they can go. For a gold holder watching a four-year horizon, that matters more than any single FOMC decision.
Lithium Extraction Hasn’t Changed Since 1850
The way the world gets its lithium is embarrassing.
They dig massive ponds in the desert. Pump brine into them. Then wait. For up to 18 months. While the sun slowly evaporates the water. In the end, just 30% of the lithium is recovered.
With lithium demand set to grow 5X by 2040, EnergyX has the answer. Their patented tech recovers 98% of lithium at speeds 500X faster than evaporation ponds.
DISCLOSURE: EnergyX’s Regulation A offering has been qualified by the SEC. Before investing, carefully review the offering circular, including the risk factors. The offering circular is available at invest.energyx.com
On the Asian demand side, the picture is constructive even after the correction. The Asian gold ETF market achieved its strongest H1 period for inflows on record, totaling $12 billion. China’s non-monetary gold imports surged in Q2, up 25% year over year in April and 63% in May. Local gold price premiums in China averaged 1% in June, their highest since April 2025. These are not technical signals. They reflect deep structural demand that does not reverse with a Fed meeting.
Looking at the current cycle through a historical lens, VanEck points out that the two previous major gold bull markets were the 1976 to 1980 cycle, which produced roughly 500% cumulative returns, and the 2001 to 2011 cycle, which produced roughly 600% cumulative returns. The current cycle, which began in 2022, has generated approximately 200% so far. Both prior bull markets experienced five corrections of 10% or more along the way. The current drawdown, severe as it has felt, is the second significant correction of this cycle. By historical standards, that is not abnormal.
What Investors Are Missing
The conversation in most investment committees is about gold the metal versus the Fed. That is the right conversation, but it is missing a second-order trade that may actually be more interesting right now: gold miners.
Gold miner stocks have historically lagged the metal on the way up and then caught up dramatically as higher prices flow through to earnings. That dynamic is playing out right now in an unusually clean way. Even with gold down from its January peak, the realized price that miners are booking is still dramatically higher than a year ago. Agnico Eagle realized $4,861 per ounce in Q1 2026, a 68% increase from the prior-year quarter, and delivered net income that more than doubled year over year. Its stock gained nearly 69% over the prior 12 months. Newmont generated $3.1 billion in free cash flow in Q1 2026 alone and returned $2.7 billion to shareholders through dividends and buybacks.
What the market has not fully processed is that miners are sitting on operating margins that were unthinkable two years ago, even at $4,000 gold. If gold stays anywhere near current levels, the free cash flow generation is extraordinary. If gold recovers toward $4,750 to $5,000 as the structural bulls expect, the earnings leverage is enormous. And if gold falls significantly? Miners at current AISC levels still generate solid cash at $3,500 per ounce or above. The asymmetry, in the current environment, arguably favors the equity over the metal itself.
Stocks to Watch
Newmont (NEM). The world’s largest gold producer, Newmont generated $3.1 billion in free cash flow in Q1 2026 and ended the quarter with a $3.2 billion net cash position. The company authorized an additional $6 billion share repurchase program in 2026. Analysts have a 2026 EPS estimate of $9.32. The stock is trading at roughly 10x forward earnings, which is genuinely inexpensive for a company generating this level of cash at current gold prices. The caveat: Newmont’s all-in sustaining costs are rising to an expected $1,680 per ounce in 2026, up from $1,358 in 2025. That cost creep is real and worth monitoring.
Agnico Eagle (AEM). Widely regarded as the highest-quality senior gold producer in the world, Agnico operates exclusively in Tier-1 jurisdictions: Canada, Australia, Finland, and Mexico. In Q1 2026, the company reported record earnings driven by the $4,861 per ounce realized gold price. It holds a net cash position of approximately $2.9 billion, has paid dividends for 43 consecutive years, and has proven and probable mineral reserves of 55.4 million ounces. The company expects to produce 3.3 to 3.5 million ounces annually through 2028, with a visible growth path toward 4 million ounces over the next decade. For investors who want gold exposure with operational discipline and minimal jurisdictional risk, AEM is the benchmark name.
Franco-Nevada (FNV). The royalty and streaming model is a different animal entirely. Franco-Nevada does not operate mines. It provides financing in exchange for royalties or streams of metal production, collecting a share of revenue from over 100 producing assets worldwide without exposure to operating cost inflation. That structure is particularly attractive right now, when rising AISC at traditional miners is eating into margins. Franco-Nevada has increased its dividend every year since its 2008 IPO, reaching 19 consecutive years of growth in 2026, and carries a debt-free balance sheet with approximately $3.4 billion in available capital. If gold miners are the leveraged play, Franco-Nevada is the quality-first play on the same thesis.
SPDR Gold Shares (GLD). For investors who want direct exposure to gold without equity risk, GLD remains the most liquid expression of the view. The fund holds physical gold and has not seen sustained outflows even during the sharp Q2 correction, with North American ETF outflows broadly offset by record Asian inflows. If the structural bull case plays out and gold recovers toward $5,000, GLD captures it cleanly. The risk is straightforward: a sustained Fed hiking cycle and stronger dollar pressure the price. It is not a complicated position. That is the point.
For Every $1 the Market Returned, This paid $25.
Retirement costs have doubled in the last six years.
The gap between what you need and what retirement requires keeps widening.
Most people won’t fully understand this until it’s too late.
Garrett Goggin has spent more than twenty years analyzing the mechanism behind this shift.
While retirement accounts struggled to keep pace with rising costs, his research returned over 1,100% in the last two years alone.
For every $1 the market returned, this returned more than $25.
Here is where the honest assessment lands. The structural case for gold, driven by record sovereign debt, central bank diversification away from the dollar, and deteriorating 60/40 portfolio reliability, remains intact. The tactical case for caution, a Fed that cannot ignore oil-driven inflation, a market pricing in a September rate hike, and North American ETF outflows, is also real. What this is not is a broken bull market. It looks far more like the correction that comes in the middle of a long cycle, the kind of correction that prior gold bulls experienced multiple times between 2001 and 2011 and kept going. The investors who tend to get this right are the ones who separate the noise of the next FOMC meeting from the signal of a multi-year structural shift. Those are two very different conversations, and right now Wall Street is mostly having the wrong one.